The word ‘ahoy!’ is an old maritime warning, usually used when either a ship or land was sighted in the distance as a warning to the crew to beware. Today, the risk of higher inflation down the line has been sighted by both economists and – of late – the markets.
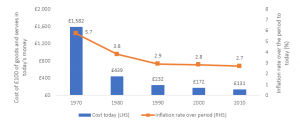
It is something that investors have not really been focusing on since the global financial crisis, with everything else going on. Yet, inflation is the silent enemy of the long-term investor that eats away at the purchasing power of their assets. Even benign inflation can do damage. The ‘Rule of 72’ estimates how quickly prices will double; all we have to do is to divide 72 by the rate of inflation. If the Bank of England is successful at meeting the 2% per year inflation target set for it by the UK government, prices will double every 36 years (72/2). If inflation is higher, then the time to double will be quicker. For example, at 6% inflation prices double every 12 years. The chart below provides an insight into the impact of inflation on spending power in the UK. It shows how much £100 of goods or services bought at some point in the past would cost today. Even since 2010, things now cost around 30% more than they did.
Figure 1: How much £100 of goods and services in the past would cost today.

Source: Bank of England[1]
Without turning this short note into an economics lecture, a simple model that explores the balance between buyers and sellers of goods and services can be useful when thinking about inflationary pressures. On the buyers’ side we have the amount of money in supply (M) and the number of times this money is used to buy goods and service in a year (the ‘velocity’ of money or V). On the sellers’ side we have the price of goods (P) and the amount of goods and services produced (Y). As everyone knows an equation needs to balance; so, MV=PY. Since the Covid-19 crisis began, governments around the world have pumped huge amounts of money into the economy, via both quantitative easing and huge stimulus packages, not least the US$1.9 trillion package being touted by the Democrats in the US. The money supply in the UK, and other major economies, has grown dramatically in the past 12 months.
So far, because people have been restrained from buying goods and services in lockdown, the velocity of money has been low, and spare production capacity exists in the economy resulting in little pressure on prices. Yet as the vaccine program rolls out and we emerge from lockdown constraints, people will begin to satisfy their pent-up demand – using accumulated savings – to buy goods and services, raising the velocity of money back to more normal levels. On the supply side, economic output should grow utilising spare capacity and creating new jobs. But if the money chasing goods and services (MV) outstrips the output of the economy (Y), then prices (P) will rise. This is certainly a plausible scenario and the bond markets have responded to this lately, pushing yields up in compensation and, as a consequence, bond prices down.
So, what would this mean for your portfolio? Over the medium to longer-term, equities do a good job of delivering investors with returns above inflation. In the shorter term it is hard to know what the impact on equities will be as on the one hand higher bond yields may undercut equity valuations, whilst on the other, growing optimism and economic growth of a post-lockdown world may improve prospects for company earnings. No-one knows. On the bond side, the threat of inflation tends to drive yields higher and bond prices lower. Fortunately, the bulk of bonds owned in your portfolio are shorter-dated, where price changes are much smaller than longer-dated bonds and the time it takes for you to benefit from this rise in yields will be much quicker.
Inflation (perhaps) ahoy! But no need to panic. Sail on.
If you have any questions, thoughts or actions relating to the content of this article please get in touch with us by calling us on 028 9099 6948 or by emailing info@pacem-advisory.com
Risk warnings
This article is distributed for educational purposes and should not be considered investment advice or an offer of any security for sale. This article contains the opinions of the author but not necessarily the Firm and does not represent a recommendation of any particular security, strategy, or investment product. Information contained herein has been obtained from sources believed to be reliable but is not guaranteed.
Past performance is not indicative of future results and no representation is made that the stated results will be replicated.
[1] www.bankofengland.co.uk/monetary-policy/inflation/inflation-calculator


