Category

News

From Letting to Regretting

For decades, individuals have had a deep-rooted obsession with property, often viewing buy-to-let investments as a surefire path to wealth. However, the reality of managing such properties, with its financial and emotional burdens, may not be as straightforward as it seems. While many have profited from buy-to-let, much of this success is attributed to timing and luck. Meanwhile, the media has often perpetuated the notion that pensions are ineffective, overshadowing their importance in retirement planning.

Buy-to-let investments can seem appealing due to their tangible nature and the familiarity of managing mortgage debt, often perceived as less risky. Stories of success abound, though they rarely highlight the associated stress and failures. The allure of strong gross rental yields, driven by factors like a growing population and low supply, can be misleading.

Conversely, pensions have faced criticism, partly due to past mis-selling scandals, even though they offer significant tax benefits and a stable investment environment. Despite perceptions, sensible investing involves diversifying across global markets, which have historically provided substantial returns above inflation. The same cannot be said for broad residential property markets as we explore below.

Some investors see buy-to-let as an alternative to cash deposits, especially with relatively low deposit rates and inflation eroding the value of savings by over 20% in the past 20 years[1]. The search for higher yields has driven many towards riskier investments like high-yield bonds and equities, or into the buy-to-let market. However, transitioning from cash to buy-to-let is not a minor risk adjustment but a significant leap, especially if borrowing is involved. Entering the buy-to-let market essentially means starting a highly leveraged business with all its associated costs, taxes, and risks. Without thorough planning and realistic expectations, investors may face substantial financial challenges.

Few investors would consider borrowing up to three times the value of their investment portfolio to gear up their stocks and bond assets yet buy-to-let investors often do just that. Property investing allows for easy leverage, with most buy-to-let mortgages requiring a 25% deposit. For example, a £200,000 house might involve a £50,000 deposit and £150,000 loan. This leverage can amplify both gains and losses; a 20% property price increase yields an 80% return on the invested capital, while a 20% decline results in an 80% loss. Borrowing to leverage capital carries substantial risks, including the potential for negative equity. Historically, UK residential property values have fallen by around 30% after inflation during major downturns in 1989 and 2007.

Many investors, especially those new to the buy-to-let market, are attracted by the gross yields which currently sit at around 6%. Average rental income is approximately £1,300 per month, implying an average property value of about £260,000[2]. However, the costs associated with buy-to-let investments are significant and come in three stages: initial purchase and setup, ongoing costs, and sale costs. Initial costs include stamp duty, professional fees, repairs, and certifications. Ongoing costs cover annual expenses like insurance, maintenance, and potential void periods, as well as longer-term costs for major repairs and replacements. Investors should budget around 30% to 35% of the gross income for these ongoing costs[3], excluding mortgage repayments. Any remaining income is taxed at the investor’s marginal rate, with a 20% tax credit on mortgage interest available since 2020. Finally, sale costs include agent fees and capital gains tax, unless the property is deemed a primary residence for a certain period.

When basic numbers are calculated, the true net yield of buy-to-let investments is far less compelling than headlines suggest. High property prices combined with ongoing and borrowing costs make it challenging for landlords to achieve worthwhile net yields. Using the 30% to 35% rule above and current mortgage rates, net yields can quickly fall to the 2% and below range, particularly when one assumes that the property may not be occupied 100% of the time if tenants choose to leave and cannot be replaced immediately.

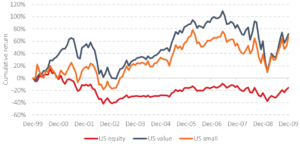
Lower yields make property price rises all the more important for buy-to-let property owners. An astute investor evaluates an asset class based on total return, combining yield and capital gain. By assuming a generous 2% net post-tax yield on an ungeared buy-to-let investment and adding it to the UK house price series, we can compare its performance against traditional investment portfolios. For fairness, a 1% annual cost is deducted from traditional portfolios, but no initial set-up costs are deducted from the buy-to-let strategy, even though they can be significant.

Figure 1: Buy-to-let versus traditional portfolios – simulated strategies after inflation 1981-2024

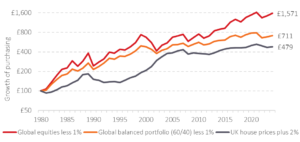
Data source: See endnote[4].

Pension funds are a core retirement pillar. Buy-to-let property is akin to owning a small business with a depreciating asset that requires constant attention to achieve returns somewhere between bonds and equities. Borrowing amplifies both risks and rewards, making it a significant leap from the deposit-like alternative often portrayed in the media. Buy-to-let is not a quick or riskless path to wealth; it involves substantial costs and demands meticulous management. In contrast, harnessing tax breaks and investing in a well-structured, globally diversified portfolio is a sensible approach to retirement planning, freeing up time for more enriching activities than managing rental properties.


Important Notes

This is a purely educational document to discuss some general investment related issues. It does not in any way constitute investment advice or arranging investments. It is for information purposes only; any information contained within them is the opinion of the authors, which can change without notice. Past financial performance is no guarantee of future results.

Products Referred to in this Document

Where specific products are referred to in this document, it is solely to provide educational insight into the topic being discussed. Any analysis undertaken does not represent due diligence on or recommendation of any product under any circumstances and should not be construed as such.

[1]      Bank of England © SONIA and UK CPI. Data to Apr-25.

[2]      ONS © Private rent and house prices, UK: April 2025.

[3]      Before it was merged with other financial bodies in 2017, the Council of Mortgage Lenders (CML) advised holding back 30-35% of rental income to service ongoing costs.

[4]      Global equities Albion World Stock Market Index (AWSMI).  Balanced (60/40) = 60% ‘Global equities’, 40% Albion 2.5Y UK Constant Maturity Bond Index.  Costs of 1% have been deducted from the ‘traditional’ portfolios and portfolios were rebalanced back to the original mix once a year. UK house prices = Nationwide House Price Index.

Stick To The Plan

Market volatility can be uncomfortable—but it’s not unusual. In fact, it’s a feature of investing, not a flaw.

Donald Trump has shocked the global markets over the past week since his Liberation Day tariff announcement. At the time of writing, the global stock market has fallen over 5% from the start of 2025, with the S&P500 down over 8% over the same time period.

However, the market decline of 3rd & 4th April is only the 39th largest drop since 1st January 2000.

During times of uncertainty, remaining invested in a globally diversified, suitable portfolio is not just prudent—it’s essential for long-term financial success.

Timing the Market is Risky—and Rarely Successful

Attempting to move in and out of markets to avoid downturns may seem appealing, but missing just a few of the best-performing days can significantly erode your returns. The cost of mistiming the market far outweighs the perceived benefit of “playing it safe.”

Casting our minds back to the Covid-19 pandemic the US stock market dropped 34 % in just 23 days — faster than ever before. Yet within a year, the market had not only recovered but also risen 78% from its lowest point. People who sold during the panic missed one of the strongest recoveries ever.

Volatility Happens Every Year

Every single year, global markets experience drawdowns—temporary declines from peak levels. These drops are normal. Intra-year declines are part of investing, yet more often than not markets tend to end the year in positive territory.

This volatility is expected and already considered in the assumptions behind your plan.

Patience is a Proven Strategy

History has consistently rewarded investors who stay calm, remain disciplined, and stick to their long-term strategy.

The chart below shows the growth in world equity markets despite the never-ending stream of negative world events – The Wall of Worry

Reacting emotionally to short-term noise can lead to poor outcomes—while staying the course is the key to wealth preservation and growth.

Your Financial Plan Already Accounts for Market Drops

We have built your financial plan with these events in mind. Our assumptions used in your plan factors in the reality of market downturns.

As part of our planning for those who require income in retirement, we include Defensive Assets – Government Bonds. This helps to protect capital value of this income, typically 5-7 years worth of income. This prevents the need to sell during a market downturn.

As always, we are here to support you, answer questions, and ensure your plan remains aligned with your goals—no matter what the markets are doing.


The declines are temporary, the long term advance is permanent.
Stick to the plan.

A Few Things About Gold…

This shiny metal always glistens most brightly when it has just risen in value. In the past 12 months, the price of gold has nearly doubled. Recency bias and the fear of missing out (FOMO) always results in ‘should it be in my portfolio?’ type questions.  Somewhat bizarrely, investors tend to get excited about assets that have already risen in value.  If one is going to play a market timing game – generally not advisable as even the pros do not have any real track record in being able to do so consistently – a long-term investor should surely be more excited about an asset that has fallen substantially in value, not risen.

It is always too easy to jump onto the ‘it’s done so well, I want some’ bandwagon. After all, owning a gold-backed ETF is just a click away on a brokerage account.  Switching from an emotional, intuitive brain to a more reflective mindset is always useful to avoid a hasty and potentially costly decision. Here are a few thoughts around gold that may be instructive or, at the very least, somewhat interesting.

Gold is in limited supply (on earth), but does this matter?

If all the gold ever mined were melted into a cube, it would measure just 22 meters on each side.  For those keen on rugby, the base of the cube would reach from the try line to the 22m line.  For tennis fans, the sides of the cube would be as long as a tennis court, give or take a meter.  According to the World Gold Council, this represents 216,265 tonnes of gold mined so far.  Unmined gold is estimated at around 50,000 tonnes. Investors who think that gold is out of this world would be right. Gold is created in the heart of massive stars during supernova explosions which produce the extreme conditions necessary for the formation of heavy elements like gold. Meteorites often contain small amounts of gold. Does that make it valuable?  Warren Buffet, the legendary investor and founder of Berkshire Hathaway does not think so.

‘Gold gets dug out of the ground in Africa, or someplace. Then we melt it down, dig another hole, bury it again and pay people to stand around guarding it. It has no utility. Anyone watching from Mars would be scratching their head…Gold, however, has two significant shortcomings, being neither of much use nor procreative… if you own one ounce of gold for an eternity, you will still own one ounce at its end’.

Warren Buffet, Legendary Investor & Founder of Berkshire Hathaway

Gold has a tarnished record as an inflation hedge

Despite being the only metal that does not corrode, its mythical reputation as a hedge against inflation is somewhat tarnished.  The definition of an inflation hedge is an asset that moves in the opposite direction to the effect of inflation, not just an asset that delivers positive after-inflation returns over longer-term periods.  Historically, gold has shown mixed results as an inflation hedge. During the 1970s, a period of high inflation in the U.S., gold prices soared, delivering impressive after-inflation returns. However, in other periods, gold’s performance has been less stellar. For example, from 1980 to 1984, despite high inflation, gold prices fell substantially.  Other alternatives, such as owning shorter-dated inflation-linked bonds is likely (but not guaranteed) to offer a better direct and more immediate hedge against inflation.

Figure 1: Gold prices compared to inflation and other assets 1-1970 to 2-2025

Source: Albion Strategic Consulting. Data: Morningstar Direct © All rights reserved (see endnote)

Gold has not performed that well against other assets

Gold has not been a particularly strong performer relative to global stocks over the past 50 years, despite its rip-roaring start to the 1970s.  After the effects of inflation, £1 turned into £7 of purchasing power for gold, £3 for UK house prices and £16 for global stocks. It would have been painful to remove global stocks from a portfolio to make way for gold.  In addition, the gold price was quite a bit more volatile than that of global stock markets, by about a quarter in fact.

Gold is a good store of value if you have a 2,000-year horizon, but not in the shorter term

Over the period from January 1980 to July 1999, gold lost around a staggering 80% of its purchasing power, making it a very untrustworthy store of value even over decades. Over the same period, the purchasing power of global stocks rose seven-fold.  Over millennia gold does, however, seem to be a good store of value!  For example, 34 ounces of gold would have paid the salary of a Roman centurion or a British Army captain today.  A pair of shoes then, and now, cost around 0.02 ounces of gold, whilst two Roman togas or a suit today would cost about the same[1].  Interesting but largely irrelevant to investors.

Timing when to invest in gold is tricky – just ask Gordon Brown 

In summary, gold has no income stream, making it hard to value.  Supply and demand changes over time, depending upon a wide range of factors, which are largely unpredictable.  Its longer-term return has been materially less than that of global stocks.  Its mythical status as a hedge against inflation is wearing a bit thin. It is hard to make a case for it as a permanent part of a portfolio.  That implies that an investor needs to time when to be in or out of gold, which has proven to be extremely difficult. Just ask Gordon Brown, the former Chancellor of the Exchequer in the UK. Between 1999 and 2002, he sold approximately 395 tonnes of the UK’s gold reserves at average price of USD275 per ounce, a multi-decade low in the gold price, leading to significant criticism and the term ‘Brown’s Bottom’! If he had sold the gold at today’s prices, it would have been worth around ten times as much.  This is probably one of the biggest single market timing mistakes of all time.  Caveat emptor! All that glistens…etc.


Important Notes

This is a purely educational document to discuss some general investment related issues. It does not in any way constitute investment advice or arranging investments. It is for information purposes only; any information contained within them is the opinion of the authors, which can change without notice. Past financial performance is no guarantee of future results.

Use of Morningstar Direct© Data

© Morningstar 2025. All rights reserved. The information contained herein: (1) is proprietary to Morningstar and/or its content providers; (2) may not be copied, adapted or distributed; and (3) is not warranted to be accurate, complete or timely. Neither Morningstar nor its content providers are responsible for any damages or losses arising from any use of this information, except where such damages or losses cannot be limited or excluded by law in your jurisdiction. Past financial performance is no guarantee of future results.

Products Referred to in this Document

Where specific products are referred to in this document, it is solely to provide educational insight into the topic being discussed. Any analysis undertaken does not represent due diligence on, or recommendation of any product under any circumstances and should not be construed as such.

Past performance is not indicative of future results and no representation is made that the stated results will be replicated. Portfolio performance data are for illustrative, educational purposes only and do not represent live client portfolios.

Asset Classes Used

Asset class Data series
Global equities Albion World Stock Market Index[2]
UK house prices Nationwide House Price index
Gold Gold price in GBP
UK inflation UK RPI

[1] Reitzer, L., (2023) Wages & Prices of Daily Goods in Ancient Rome. Wages & Prices of Daily Goods in Ancient Rome – neutralhistory.com. Accessed: 17-03-2025

[2] https://smartersuccess.net/indices

2025: Looking Backwards and Forwards

Being an investor can be emotionally challenging. If we have a bad year (like 2022), we feel uncomfortable, and even after a couple of good years (2023 and 2024), we may still worry that some of the gains made might be lost going forward. This emotional asymmetry, where the pain of losses is felt twice as deeply as the pleasure of gains, is an innate bias that has deep evolutionary roots. While it kept us alive in our ancient past, it can be a hindrance for investors.

This time of year is often referred to as investing’s silly season, where analysts, fund managers, and economists make predictions about the markets for 2025. Any sensible pundit should suggest a rise in stock markets, as they tend to go up two-thirds of the time in any given year. Markets, however, reflect known information into prices quickly and effectively and prices will only move on the release of new information, which is unpredictable. Predicting what will happen in 2025 is essentially a bet against the market, implying that the guesser has better information, or interprets existing information better than the market, which is unlikely. As a long-term investor, you have the luxury of seeing past these short-term, random walks of the markets and the opportunity to pick up the rewards for taking on this uncertainty by remaining invested.

Our market forecasts for 2025 remain unchanged.  They will go up, down or sideways!

Looking Backwards


Last year was generally another good year for most markets as the chart below illustrates.

Figure 1: Global Investment Returns – 2024 and 2023 Compared

Data: Live funds used to represent asset classes, in GBP. See endnote for details.

Like in 2023, the US market drove global stock market returns, with the ‘Magnificent Seven’ tech stocks driven by the focus on AI, interest rate cuts and the election of President Trump.  These stocks alone contributed around 50% of the total US market gains of 27%.  The combined developed and emerging markets delivered approximately 19%.  It is always tempting to wish that one was invested only in Nvidia, the ‘Mag 7’, or the US market, but every investment has its day in the sun and being well-diversified pays off in the longer term.  It is worth noting that investors in US stocks are currently willing to pay over $5 for every $1 of book value, which is at the same record high as in 2000 at the height of the dot.com mania before the crash (for those who can remember that time!).  This is not a market timing signal, but a reminder that some stocks have much demanded of them in terms of the future earnings they are expected to deliver. Maybe they will deliver, maybe not. No one knows.  Well-diversified global portfolios employing tilts to value and size, have a lower concentration risk to the ‘Mag 7’ as a consequence.  Defensive, high quality, shorter-dated bonds delivered around 5%.  UK inflation was down to 2.6% (to November) from 4% in 2023, which is good news.

A 60% stock/40% bond global balanced portfolio strategy[1] delivered a gross return of about 10% in 2024 which, after UK inflation, grew purchasing power by over 7%.  That is a pretty positive outcome on the back of a good year in 2023. Over five years, a similarly structured portfolio would have returned over 30% (after fund costs, but before any other costs).


Looking Forwards


There is no doubt that we are living in turbulent times, from the conflict in the Middle East, Russia’s war in Ukraine, China’s struggling economy and increasingly aggressive stance towards Taiwan, to the incipient presidency of Donald Trump in the US.  Pressure on energy prices and a growing concern in bond markets about government debt levels and inflation have led to higher bond yields and the possibility – but not certainty – that interest rates could remain higher for longer.  Trump’s tariff policies remain an unquantified threat to the global economy and inflation. A just end to the war in Ukraine would be a welcome, if hopeful, outcome for 2025. Uncertainty is the one forecast for 2025!

The old saying, ‘hope for the best but prepare for the worst’, is always a good mindset for investors. For those following an evidence-based, systematic approach to investing, starting 2025 with the expectation of positive equity, smaller company, and value premia is sensible. About one-third of the time, we will be disappointed in any one year. However, over time, the likelihood of capturing these premia increases. Being well-diversified is the key defence against bad times in some markets and sectors, and against specific companies’ fortunes.

It is important to remember that forward-looking views are already reflected in today’s prices.  What comes next, no-one truly knows.  As ever, the key is to remain highly diversified, resolute in the face of any market setbacks and focused on long-term goals.

For many of us, less doom-scrolling on our phones’ news apps would be a good New Year’s resolution.  Perhaps download a positive news app instead (e.g. Squirrel News, Goodable or Positive News).

From an investing perspective, as ever, we remain hopeful for the best in 2025 but remain prepared for the worst.

“Choose to be optimistic, it feels better.”

Dalai Lama


Happy New Year!


Important Notes

This is a purely educational document to discuss some general investment related issues. It does not in any way constitute investment advice or arranging investments. It is for information purposes only; any information contained within them is the opinion of the authors, which can change without notice. Past financial performance is no guarantee of future results.

Products referred to in this document 

Where specific products are referred to in this document, it is solely to provide educational insight into the topic being discussed. Any analysis undertaken does not represent due diligence on or recommendation of any product under any circumstances and should not be construed as such.

Past performance is not indicative of future results and no representation is made that the stated results will be replicated. Portfolio performance data are for illustrative, educational purposes only and do not represent live client portfolios.

Data Series Used 

Asset class Fund ISIN Weight in 60/40
Gbl market Fidelity Index World P Acc GB00BJS8SJ34 27.5%
Gbl value Dimensional Global Value GBP Acc IE00B3NVPH21 9.2%
Gbl small cap Vanguard Glb Small-Cp Idx £ Acc IE00B3X1NT05 9.2%
EM Fidelity Index Emerging Markets P Acc GB00BHZK8D21 4.9%
EM value Dimensional Emerging Mkts Val GBP Acc IE00B0HCGX34 1.6%
EM small cap iShares MSCI EM Small Cap ETF USD Dist IE00B3F81G20 1.6%
Gbl property L&G Global Real Estate Div Index I Acc GB00BYW7CN38 6.0%
Short, high qual bonds Dimensional Global Short Dated Bd Acc GB0033772848 36.0%
UK IL gilts Dimensional £InflLnkdIntermDurFI GBP Acc IE00B3PVQJ91 4.0%

More information is available on request.

[1] See table in endnote for example portfolio allocations.  This is for illustrative purposes and does not reflect the performance or structure of any specific client portfolio.

Playing the Probabilities

Five Key Probabilities for Investment Success


In life we make probability-driven choices all the time (can I cross the road safely, despite that approaching car? etc.). By-and-large, we weigh up the uncertainty involved, the upside on offer and then dive right in.  Not all our decisions are optimal.  Did we understand the risks fully? Did we know what the up and downside consequences were and, importantly, the likelihood of them happening?

When it comes to investing, we face similar challenges, but fortunately we have a wealth of market data and evidence to help us make better informed decisions around where the probability of success lies.  To avoid the serious consequences of getting it wrong, e.g. building too small a pot to retire comfortably on, or running out of money in retirement, there are five key probability-based choices to focus on.

Key Probability 1: Stocks are likely to beat cash over most 20-year horizons

Using a long-run global stock market data set, the evidence suggests that over 98% of the time, stocks beat cash over a 20-year timeframe. Most investors have investment horizons of at least that. Over the period Feb-55 to Sep-24 stocks delivered around 5.6% above inflation against 1.2% for cash.  There are no guarantees, but the odds are stacked in your favour.

Figure 1: Stocks are likely to beat cash over time

Source: Albion World Stock Market Index versus UK One Month Treasury Bills

Conclusion: Make sure you invest.  For most long-term investors a substantial holding in stocks makes good sense.  What that level is will depend on your personal circumstances.

Key Probability 2: Owning the market, over trying to be too clever, is likely to pay off

Investment theory suggests that markets work well at incorporating information into securities prices.  In other words, there are few £20 notes lying around on the investment pavement to be scooped up by professional fund managers and other investors, to allow them to beat the market.  Empirical data show that very few professionally managed funds beat the market, and even fewer with any proven degree of skill.

Figure 2: Only 5% of global equity funds beat the market over 20 years

Source: Albion GAMETM 24.5 – global equity funds to June 2024.

Conclusion: Holding the market and capturing the returns on offer should be your overriding priority, rather than trying to pick fund managers who claim to be able to beat the market. Even if they appear to have track records suggesting they can, are they just lucky or skilled?  You need decades of results to work out which. Play the odds overwhelmingly in your favour.

Key Probability 3: Diversification is likely to deliver a better outcome than concentration 

Research shows that the entire wealth created in the US equity market since 1926 has been driven by just 4% of companies.  The story is similar for global markets. As evidenced above, few professional fund managers can spot these companies in advance. Holding a concentrated portfolio of ‘guesses’ is less likely to lead to a worse outcome than the broad market. In general, diversification helps to smooth the returns of a portfolio as some investments zig while others zag. Some concentrated portfolios may get lucky, but that’s a gamble.

Figure 3: US 1926-2015 – only a handful of companies created all the wealth

Source: Bessembinder, H. (2018). Do stocks outperform Treasury bills? Journal of Financial Economics, 129(3), 440–457. https://doi.org/10.1016/J.JFINECO.2018.06.004

Conclusion: This suggests that being well-diversified is likely to play out in your favour. It ensures that the wealth creators of the future will be held in your portfolio. You might get lucky with a concentrated portfolio, but the odds are not in your favour.

Key Probability 4: Holding sensible exposures to well-researched risk factors should pay off

Not all equities have the same risk.  Behemoths, such as Microsoft and Apple, are very different to smaller companies. Rapidly growing companies are very different to stocks that are less financially healthy.  The market prices these shares accordingly.  The historical evidence suggests that, on a relative basis, companies that are smaller and/or less financially healthy, are cheaper than larger companies and rapidly growing companies. They are cheaper for a reason – they are riskier.  The flip side of the coin is that this higher risk is expected to deliver higher returns over time.

Figure 4: The chances of capturing excess returns improves over time

Source: Ken French Data Library – US three factor model[1]

Conclusion: For investors with longer horizons, taking on these additional risks has a higher expected chance of paying off.  Incremental returns compounded over time could make a material difference to outcomes. 

Key Probability 5: Reducing costs is likely to deliver higher returns

As a general theme, lower costs of investing are better than higher costs. As an example, take two global equity funds that before costs deliver a return of 5% per annum.  Fund A has an ‘all-in’ cost of 1% and Fund B 0.30%. Over 30 years the investor in Fund B will accumulate 24% more wealth than the investor in Fund A.

Figure 5: Lower costs improve the chances of better outcomes.

Source: Albion Strategic Consulting. Professor William Sharpe’s Terminal Wealth Ratio.

Conclusion: Keep a keen eye on costs.  The cost-to-outcome relationship is real and important in investing. Lower cost solutions will, in all likelihood, improve your chances of a good investment outcome, all other things equal.

In all likelihood…

Investors who play the probabilities in their favour deserve – and are likely to experience -better investment outcomes than those who fail to do so.  Do not gamble on your future.


Important Notes

This is a purely educational document to discuss some general investment related issues. It does not in any way constitute investment advice or arranging investments. It is for information purposes only; any information contained within them is the opinion of the authors, which can change without notice. Past financial performance is no guarantee of future results.

Products Referred to in this Document

Where specific products are referred to in this document, it is solely to provide educational insight into the topic being discussed. Any analysis undertaken does not represent due diligence on or recommendation of any product under any circumstances and should not be construed as such.

[1]https://mba.tuck.dartmouth.edu/pages/faculty/ken.french/Data_Library/f-f_factors.html

Diversifying in the US

As the year draws to a close, 2024 truly has been the year of elections. This year, it was forecasted that more voters than ever, across 64 countries, would head to the polls to cast their votes on the future leadership of their countries[1].

The Presidential election in the US, as a significant global power and a dominant exposure in investors’ portfolios, naturally gathered a lot of attention. Donald Trump’s resounding victory saw him not only claim the White House but the coveted trifecta – the presidency plus both chambers of Congress (the House and the Senate). Regardless of one’s political or economic views, the world will be keeping a close eye on what comes next for the US.

In stock markets, investors are constantly casting their own ‘votes’ in anticipation of what they feel the future holds, some more optimistic, some more pessimistic. The aggregated view of all investors leads to a consensus in the form of the current market price. All known information has already been accounted for in today’s market prices, and these prices will only move further on the release of new information which is, by definition, random.

There are, of course, those that will disagree with today’s market price and try to reposition a portfolio to harness perceived opportunities. Unfortunately, the evidence suggests few possess any ability to do so successfully and consistently through time[2].

Diversification – that is, spreading eggs across baskets – is a central pillar to our investment philosophy. We ensure that diversification is not only achieved across countries but also within them. Exposure to any particular region, including the US, extends beyond the biggest companies in the market through the use of systematic tilts to smaller companies and value companies (those with low prices relative to their fundamental measures such as book value or sales).

Different areas of the market perform strongly at different times – unfortunately there is no way of knowing which will be next, in advance. In the US, the past decade has been dominated by large tech-based stocks. The next decade may be entirely different. Or it may not.

The ‘lost decade’ of 2000-2009 highlights this point well, known as a time period where the US stock market delivered little back to investors. The decade saw the S&P 500 deliver a period of negative returns, as highlighted in the chart below. The Dot-Com Crash of the early 00s, followed by the Global Financial Crisis meant for tough times.

That being said, it was not all doom and gloom. Those with incremental tilts to smaller and value companies benefitted from the diversification these exposures offered, as parts of the market that delivered materially positive returns. Those driven to omit large US companies from their portfolio on the basis of this poor performance would have missed out on the strong performance that has come to pass since.

Figure 1: The lost decadewhere not all was lost

Source: Dimensional Returns web: US value: Fama/French US Value Research Index and US small: Fama/French US Small Cap Research Index. Morningstar: US equity: Vanguard U.S. 500 stk idx $ Acc. Returns in GBP.

Large US stocks are typically the dominant part of investors’ portfolios. The fact that this part of the market has delivered strong returns is therefore good news and has helped investors experience returns that lend well to being able to achieve one’s financial goals. Pining after more return on seeing strong stock market performance in regions such as the US is best avoided and can lead to wealth-destroying behaviour such as performance chasing.

No-one truly knows what the future holds. Keeping focused on the long-term, remaining diversified and having consistent exposure within each region continues to be the best line of defense – and provides the best opportunity – for whatever lies ahead.


Important Notes

This is a purely educational document to discuss some general investment related issues. It does not in any way constitute investment advice or arranging investments. It is for information purposes only; any information contained within them is the opinion of the authors, which can change without notice. Past financial performance is no guarantee of future results.

Products Referred to in this Document 

Where specific products are referred to in this document, it is solely to provide educational insight into the topic being discussed. Any analysis undertaken does not represent due diligence on or recommendation of any product under any circumstances and should not be construed as such.

[1] Time.com

[2] Albion’s latest GAME study highlights this point with only 3% of active managers managing to outperform their benchmark over the last 20 years. Albion Governance Update 28. Period of 20 years ending June 2024. Global equities asset class.

Presidents Change, Markets Remain

Another four years have flown by, and here we are again, on the morning of the 60th U.S. presidential election.

The U.S. president is often considered one of the world’s most powerful figures, wielding substantial influence over the world’s largest economy and one of its most formidable militaries, albeit limited by a system of checks and balances through Congress. Perhaps it is understandable that the media, politicians, celebrities and business owners alike wish to make their voice heard during campaign season… it is noisy time of year!

At the time of writing, the race remains extremely close. Former President Donald Trump is pursuing a second term for the Republicans, while Vice President Kamala Harris hopes to make history as the first female president for the Democrats. Polls and betting markets are sharply divided; predictive sources like The Economist and other major polls lean toward a Harris victory[1], yet many prominent bookmakers see Trump as the frontrunner[2].

It has been a roller coaster, what with President Biden’s withdrawal from the race, an assassination attempt that thankfully failed, Elon Musk coming in to bat for Trump and Taylor Swift for Harris, and the usual fierce partisanship from both sides. One way or another, we will soon wake to the news of the victor and the serving president for the next four years.

For investors, it is natural at times of political uncertainty to wonder whether they ought to act, perhaps altering their portfolio to position for a specific outcome, or to move money into cash deposits until things ‘settle down’. Some choose to invest this way, mostly at their peril, as very few managers possess the ability to consistently predict such events[1].

A better strategy, as is adopted in your portfolio, is to outsource this guesswork to the market itself, relying on the millions of daily participants to come up with their expectations and reflect them in prices. Thankfully, given both democrats and republicans support capitalism and believe in personal freedom and property rights, this strategy is a tried and tested approach to investing.

The chart below shows the Global equity market return over the last century or so, where the colours represent whether the sitting US president was Republican (red) or Democratic (blue) at the time. There is little to draw from the red and blue sections, both parties have resided over some fantastic periods, and some not so fantastic ones. However, the ability of capitalism to create wealth despite the ups and downs is evident, with $1 invested in 1926 becoming nearly $10,000 by 2024.

Figure 1: Democratic (blue) and Republican (red) Presidents and equity market returns

Source: Dimensional Returns. Index: Albion World Stock Market Index[1]. Date: 07/26-09/24. Returns in USD.

The challenge is that it is not enough to know what the outcome of this election will be, one also needs to know – without the benefit of hindsight – how the market will react once the event occurs. Would a Trump victory be good or bad for markets? What about a Harris win? Answering these questions is akin to guesswork, despite what some of the financial press might have us believe.

Whilst guessing against randomness is impossible, taking on the known risk that equity returns are far less certain than holding cash rewards investors who ignore this short-term noise and focus on the long-term.  The choice of the US President is important to some, but to the long-term investor it is largely irrelevant.

“He who lives by the crystal ball will eat shattered glass.”

Ray Dalio, CIO of Bridgewater Associates


Important Notes

This is a purely educational document to discuss some general investment related issues. It does not in any way constitute investment advice or arranging investments. It is for information purposes only; any information contained within them is the opinion of the authors, which can change without notice. Past financial performance is no guarantee of future results.

Products Referred to in this Document 

Where specific products are referred to in this document, it is solely to provide educational insight into the topic being discussed. Any analysis undertaken does not represent due diligence on or recommendation of any product under any circumstances and should not be construed as such.

[1] The Economist (2024). https://www.economist.com/interactive/us-2024-election/prediction-model/president

[2] Oddschecker – US Presidential Election. https://www.oddschecker.com/politics/us-politics/us-presidential-election/winner

[3] Albion GAMETM 24.5 – 90% of US equity fund managers were beaten by the MSCI USA IMI Index 20Y to Jun-24.

[4] https://smartersuccess.net/indices

Autumn 2024: Budget Round-Up

National Insurance 

On an employer level (class 1 NIs) the rate will increase from 13.8% to 15% from 6th April 2025. This will apply on employee earnings above £5,000 (rather than £9,100 at present) with this level frozen until 6th April 2028.

Employers with an NI bill of less than £100,000 can get £5,000 relief from the charge. From 6th April 2025 this will be replaced by a flat £10,500 allowance for all businesses.

In practical terms this means a company will not pay class 1 NIs where the total remuneration bill is £75,000 or less.

Class 2 and Class 3 NI rates will also see changes from 6th April 2025. The Lower Earnings Limit (LEL) and Small Profits Threshold (SPT) which underpin these rates will increase by 1.7% from 6th April 2025.


Capital Gains Tax (CGT)

The rate of CGT will align with the rates currently applied to property. Effective immediately (and so on transactions from 30th October), the rates will be:

  • 18% for gains within the basic rate tax band (up from 10% currently)
  • 24% for gains above the basic rate tax band (up from 20% currently)

There is to be no change to the annual exemption of £3,000.


Pensions 

Pension funds will become subject to Inheritance Tax (IHT) from 6th April 2027. This will mean that funds left in a defined contribution pension on death will form part of the estate for IHT purposes.

For deaths after the age of 75, the income tax charge will continue to apply so funds being inherited in this way will potentially be subject to IHT, first, and income tax when accessed thereafter.

These changes do not affect Defined Benefit (DB) / Final Salary pensions in terms of the spouse/dependent pension provided on death. Lump sums paid out would potentially be subject to IHT, as would lump sums paid as part of a death-in-service plan.


Inheritance Tax (IHT)

The thresholds, allowances and tax rates are all unchanged. This means the Nil Rate Band (NRB) remains at £325,000 and the Residential Nil Rate Band (RNRB) at £175,000 unless tapering applies.

Business Relief (BR) and Agricultural Property Relief are being reformed with only the first £1 million being eligible (from 6th April 2026) for full IHT relief. Amounts above £1 million are only relievable at 50% (which gives an effective IHT rate of 20% on these assets).

Shares in Alternative Investment Market (AIM) companies only receive IHT relief on 50% of the amount held (again from 6th April 2026).

Pensions, as mentioned above, are brought into IHT from 6th April 2027.


Tax and Saving Allowance 

All tax and saving allowances will remain frozen until 5th April 2030. This means no changes to:

  • Personal allowance
  • Personal savings allowance
  • Starter rate for savings allowance
  • Dividend allowance
  • CGT exemption
  • ISA allowance
  • LISA allowance
  • JISA allowance

The British ISA will be scrapped.


General

The additional dwellings surcharge on Stamp Duty Land Tax (SDLT) will rise from 3% to 5% from 31st October 2024.

Minimum wage increase from £11.44 to £12.21 from 6th April 2025, and an increase from £8.60 to £10.00 for 18-20 as part of a plan to phase this rate with the main rate.

Setting Sensible Expectations for Investment Returns

“Man has the hardest job of all, the job of making decisions on incomplete data.”

Henry Kuttner

When market returns are kind, as they have been in recent times, it can be too easy to forget that bad times in investing will come along at some stage, leading to large and/or protracted falls in value. We hope markets are kind, but without a crystal ball no investor possesses any ability to accurately forecast the ‘whats, whens and hows’ of such downturns.

As your adviser, part of our role is to stress test your financial plan – using what we understand about markets – to ensure that your ability to achieve your financial goals is built on reasonable expectations. We recognise that markets give and take.

One important element of planning for the future is building a reasonable understanding of what a portfolio of investments can deliver. We follow a logical framework to achieve this, illustrated in the graphic below. Following such a framework helps us form central case expectations of future returns. The words ‘central case’ are important here – these assumptions sit at the centre of a wide distribution of possible outcomes.

Figure 1: A logical framework for setting sensible expectations for investment returns

Source: Albion Strategic Consulting

To illustrate the point that returns from stock and bond markets are not expected to come in straight lines, consider the figure below. We take the average calendar year return of global stock markets[1] from the past 30 years (1994 to 2023) – which was an impressive 9.4%, before inflation – and the volatility (a measure of how bumpy the ride was) over the same period of 18%. The figure shows one hundred 10-year simulations with the same average return and same volatility as inputs – perhaps the futures of one hundred alternative universes!

Figure 2: One hundred 10-year return simulations, growth of 100,00

Source: Albion Strategic Consulting. One hundred 10-year Monte Carlo simulations using arithmetic average return of Albion World Stock Market Index (https://smartersuccess.net/indices) from 1994-2023 (9.4%) and standard deviation of annual returns (18%), priced in USD in nominal terms.

Ultimately, an investor won’t know which one of an infinite number of possible paths they are on until after the fact. This is why it is important to make sensible expectations about the future returns markets could deliver, and crucially meet with your adviser on a periodic basis to see which path markets could be taking.

During tough times, this might mean curtailing spending or saving more – part of the role of your financial planner is to advise if and when this might be necessary. The longer one remains invested, the greater the opportunity for shorter term noise to subside and longer term expected outcomes to prevail. A financial plan built on sensible assumptions and maintained through time gives investors the best chance of achieving their financial goals.


Important Notes

This is a purely educational document to discuss some general investment related issues. It does not in any way constitute investment advice or arranging investments. It is for information purposes only; any information contained within them is the opinion of the authors, which can change without notice. Past financial performance is no guarantee of future results.

Products Referred to in this Document

Where specific products are referred to in this document, it is solely to provide educational insight into the topic being discussed. Any analysis undertaken does not represent due diligence on or recommendation of any product under any circumstances and should not be construed as such.

The Golden Illusion

By its very nature, the investing industry is full of differing views on how one ought to invest their hard-earned cash. One of the more polarising debates is whether an investment in gold, physically or synthetically via an investment fund, makes good sense. The debate tends to flare up each time gold experiences a rapid growth in value, such as in the last couple of years.

The Pros

Gold is believed to form during cataclysmic events like supernovae, when massive stars exhaust their fuel and explode, or during the collision of two neutron stars – ultra-dense remnants of supernovae. Due to its lustre and durability, gold has long been prized for jewellery; however, its uses go beyond being just a desirable accessory. It is an excellent conductor, highly malleable, stable at high temperatures and inert, meaning it does not rust. These properties make gold invaluable in industries like electronics, medicine, and aerospace.

Perhaps it is no wonder that humanity has coveted gold for well over 6,500 years[1]. This enduring demand is where the value of gold comes from, and its attractiveness to investors. One impressive quality of gold is that it has retained purchasing power across the centuries. For example, in gold terms a Roman centurion of 2,000 or so years ago was paid broadly the same as a US army captain today[2]. It is this that leads some to propose physical gold as a long-term hedge against the collapse of fiat currency and global capital markets.

Other positives are that gold offers uncorrelated returns to traditional assets such as bonds and equities, providing potential diversification benefits. Unlike many investment opportunities, gold is a relatively simple concept – being a lump of metal with a market value – and is easily accessed via physical purchase or low-cost open-end funds.

The Cons 

As a commodity, gold prices are simply a function of supply and demand. Investors in gold assume that others will desire it even more avidly in the future, with each new buyer hoping that others will follow. If this sounds quite speculative, it’s because it is!

Estimating what to expect from an investment in gold, even over extended periods, is a difficult task. Unlike traditional asset classes, gold produces no income stream[1], it does not pay dividends and usually costs owners to store and insure it. As a result, many assume its long term expected return to sit somewhere near cash, which is underwhelming from a growth perspective compared to sensible alternatives.

The chart below shows the increase in value of 1 ounce of gold from 1926 to August 2024, rising from around $20 to just over $2,500. Investing the same $20 in global equities during this period would have delivered a substantially superior outcome, nearly 50 times the cumulative gain. It’s also important to note that this time frame includes extended periods where government policies, such as the Bretton Woods Agreement, influenced gold prices.

Figure 1: Annual gold spot prices against global equities: 1926-2024

Data Source: Gold.org. Inflation: US CPI. Albion World Stock Market Index. https://smartersuccess.net/indices 

As an Armageddon hedge, investors face a dilemma. Due to its bulk, weight, and the associated costs of storage and management, many opt for synthetic products like gold-backed funds or ETFs instead of owning the metal directly. If the goal is to hedge against a collapse of the financial system, relying on that system to achieve exposure to gold makes little sense. Owning physical gold comes with its own challenges too, such as storage and risk of theft.

Gold proponents may point to inflation hedging as the main attraction, but the evidence is unconvincing. While gold has maintained its value over millennia, across more useful time horizons to investors the results are less impressive. The table below shows that, after inflation in USD terms, gold has yet to get back to its February 1980 high nearly 45-years ago. It also suffered an 83% fall in value over the subsequent two decades – hardly a reliable inflation hedge!

Table 1: Real gold price declines 

Data Source: Gold.org. Inflation: US CPI.

The Portfolio

Like any investing decision, gold has its pros and cons. Assessing whether it belongs in your investment portfolio is the job of our investment committee. Each asset class must fill a specific role in your portfolio and is weighed up against the alternatives. Gold has some favorable characteristics, but you must take something out to put another thing in. Superior options exist, such as shorter-dated high-quality bonds and inflation-linked bonds on the defensive side and developed and emerging market equity as well as commercial property on the growth side.

Table 2: Assessing the role of gold in your portfolio 

As Warren Buffet succinctly puts it:

“If you own one ounce of gold for eternity, you will still only own one ounce at its end.”

(Warren Buffet, 2012)


Risk Warnings

This article is distributed for educational purposes only and should not be considered investment advice or an offer of any security for sale. This article contains the opinions of the author but not necessarily the Firm and does not represent a recommendation of any particular security, strategy, or investment product. Reference to specific products is made only to help make educational points and does not constitute any form or recommendation or advice. Information contained herein has been obtained from sources believed to be reliable but is not guaranteed.

Past performance is not indicative of future results and no representation is made that the stated results will be replicated. 

[1] Whilst gold itself does not produce an income stream, financial institutions may try and claw back some of the storage costs through gold lending revenues.

[1] Smithsonian (2016) https://www.smithsonianmag.com/…

[2] Erb, Claude B. and Harvey, Campbell R., The Golden Dilemma (May 4, 2013). Available at SSRN: http://ssrn.com/abstract=2078535 or http://dx.doi.org/10.2139/ssrn.2078535