

The cryptocurrency (crypto) landscape, and that of other digital assets, continues to evolve. Recent headlines – coinciding with the rise in the price of cryptocurrencies such as Bitcoin – have reignited interest. Technological innovations in the crypto space are, without a doubt, exciting. Yet, despite the noise, our message remains consistent: for most investors, there is no need to alter portfolios to gain exposure to this volatile and speculative investment opportunity.
Ironically, once the poster child for decentralisation, crypto is now deeply enmeshed in politics. As The Economist recently noted, the industry has become “the ultimate swamp asset” – a magnet for lobbying, regulatory arbitrage, and self-dealing[1].
The approval of spot Bitcoin ETFs in the US in early 2024 was hailed as a milestone. Yet this development changes little for long-term investors. The underlying volatility, lack of intrinsic value, and speculative nature of crypto remain unchanged. Legislation may become more supportive in time towards crypto, but that alone does not change the underlying characteristics of Bitcoin and many other cryptocurrencies.
Crypto is not ignored, but considered as part of the regular and thorough review process of investment portfolios (along with many other possible investment opportunities). In this short note we investigate three points relevant to investors in a diversified portfolio considering a distinct allocation. The investment solution we recommend to you is the result of the risk-focused approach adopted by our Investment Committee.
1. The role of crypto in an investor’s portfolio is unclear
Each allocation in an investor’s portfolio should have a defined role. For stocks, this is to act as a growth engine. For bonds, this is to act more defensively. The role that crypto would play is unclear.
Some cryptos – such as Bitcoin, the cryptocurrency with the longest, but still relatively short, track record – have dramatically increased in price since their launch. Cryptocurrencies lack intrinsic value – they do not produce cashflows like stocks and bonds do. Lately, much of the price appreciation of crypto could be down to speculation of more favourable legislation. Without regulatory barriers, future price rises for cryptos such as Bitcoin are suggested to come from the notion that it is a store of value.
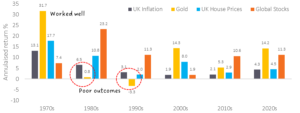
The volatility of the price of a bitcoin[2] (BTC) demonstrates that it is entirely unsuitable as a store of value, demonstrated in the figure below showing the range of monthly returns in the past five years. Note the wide axis range: the volatility of the price of a bitcoin makes the stock market look relatively stable – in fact, it is anything but!
Figure 1: Range of monthly returns of bitcoin price versus stocks over the last five years
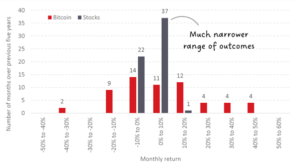
Source: Albion Strategic Consulting. Albion World Stock Market Index (https://smartersuccess.net/indices). Jul-20 to Jun-25. Returns in USD. BTC monthly returns downloaded from coincodex.com
It is difficult to understand the economic rationale for a return, making the role that a distinct crypto allocation would play in a portfolio unclear, irrespective of whether an allocation could actually be made with robust products at this stage.
2. Putting the track record of crypto into context
Some crypto advocates may argue that the track record of crypto is now sufficient to legitimise it as an asset for inclusion in portfolios. The first bitcoin was minted in 2009. Many other cryptos are much younger than this. It was some time before Bitcoin or crypto became a household term – Bitcoin was first added to the Oxford English Dictionary in late 2014[3]. This pales in comparison with the well over 100 years of history of stock and bond returns across many different regions.
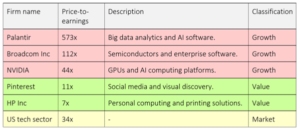
It is true that the returns for those fortunate enough to mine or purchase bitcoins in the early days have been fantastic, some 100% p.a. (!) between August 2011 and May 2025[4], however this is to fall into one of the most common traps investors face – investing using the rear-view mirror. A 1.5x levered position in NVIDIA would broadly have delivered investors with the same return as bitcoin over this period[5] – that alone does not make either option a sensible investment choice for the future, for what might seem more obvious reasons. A portfolio built on past performance alone quickly leads to exposures to unanticipated and perhaps unwanted risks.
Technologies such as blockchain-based tokenisation may be explored, developed and adopted. Investing in a diversified portfolio of stocks and bonds allows investors to benefit from the advances in digital assets as they are adopted by the companies whose stocks investors own. If companies profit from exposure to crypto (either indirectly through the goods or services they sell, or directly through holding crypto reserves), then investors are rewarded in the form of dividends or share price appreciation – examples include MicroStrategy (600,000 BTC)[6], MARA Holdings Inc. (50,000 BTC)[7] and Riot Platforms Inc. (20,000 BTC)[8].
The digital assets industry is large and contributes to the world’s economy to the point they cannot be completely dismissed. Investing in systematic, diversified low-cost funds positions a sensible investor right where they would want to be. Diversified enough so that their portfolio is not overly impacted by moves in cryptocurrency markets, but still invested in companies that can provide the rewards of the innovation and advancements that blockchain technology and perhaps cryptocurrency might bring.
3. Complexity and perceived sophistication do not make something a good investment
An innovative product will not necessarily be revolutionary. There are many highly technical solutions in the digital assets space with exciting prospects, but without the benefit of hindsight it is impossible to know what technologies will become commonplace.
“Investors read confusing, jargon-laden articles and become convinced that smarter people than themselves are investing, so they they should too’ [9]
Any investor should seek to understand the risks involved in investment decisions. Cryptos are highly complex, and it is likely that few truly understand the nature of, and risks involved with, ownership. The ongoing governance process surrounding a direct exposure to crypto would be resource intensive, complex, and perhaps insufficient. A useful rule of thumb is to avoid investments in anything where you cannot fully understand and explain the risks involved.
The portfolio we recommend to you is built on evidence, not excitement, through taking on well understood risks. The portfolio is globally diversified, low-cost, and designed to capture long-term market returns. The role of the Investment Committee is to continually reassess the entire investible landscape, and if crypto ever becomes a mainstream, investable asset with a clear role in portfolio construction, it may deserve a distinct allocation in portfolios. We are a long way from that right now. For now, we remain comfortable with our position: no action required.
Important Notes
This is a purely educational document to discuss some general investment related issues. It does not in any way constitute investment advice or arranging investments. It is for information purposes only; any information contained within them is the opinion of the authors, which can change without notice. Past financial performance is no guarantee of future results.
Products Referred to in this Document
Where specific products are referred to in this document, it is solely to provide educational insight into the topic being discussed. Any analysis undertaken does not represent due diligence on or recommendation of any product under any circumstances and should not be construed as such.
[1] The Economist, 2025. $WAMP coins: Crypto has become the ultimate swamp asset. [online] 17 May. [Accessed 22 Jul. 2025].
[2] For those eagle-eyed, grammar focussed readers the ‘b’ in bitcoin is not capitalised here. The official Bitcoin glossary states: ‘Bitcoin – with capitalization, is used when describing the concept of Bitcoin, or the entire network itself. e.g. “I was learning about the Bitcoin protocol today.”
[3] Oxford English Dictionary, Bitcoin, n., Oxford University Press, 2014, last modified December 2024. Available at: https://www.oed.com (Accessed: 22 July 2025).
[4] Curvo, 2025. Bitcoin: historical performance from 2011 to 2025. [online] Available at: https://curvo.eu/backtest/en/market-index/bitcoin?currency=gbp [Accessed 22 Jul. 2025].
[5] Illustrative only; assumes constant returns and ignores borrowing costs, volatility drag, and risks like margin calls or liquidation.
[6] Cointelegraph, 2025. Strategy Inc. buys 6,220 more BTC at ATH. [online] Available at: https://cointelegraph.com/news/strategy-buys-6220-bitcoin-btc-ath-122k [Accessed 22 Jul. 2025].
[7] MARA, 2025. MARA Reports June 2025 Bitcoin Production and Mid-Year Outlook. [online] Available at: https://ir.mara.com/news-events/press-releases/detail/1398/mara-reports-june-2025-bitcoin-production-and-mining-operations-update-issues-mid-year-outlook [Accessed 22 Jul. 2025].
[8] Riot Platforms, 2025. Riot Announces June 2025 Production and Operations Update. [online] Available at: https://www.riotplatforms.com/riot-announces-june-2025-production-and-operations-updates/ [Accessed 22 Jul. 2025].
[9] Pickard, A. (March 2022). ‘Cryptocurrencies: The Power of Memes’. https://www.researchaffiliates.com/
bitcoin – without capitalization, is used to describe bitcoins as a unit of account. e.g. “I sent ten bitcoins today.”; it is also often abbreviated BTC or XBT.’


Recent Comments